Mesh Rider Field and Bench Testing Guide
Introduction
This guide is designed to provide guidelines for field and bench testing Mesh Rider radios and to help you avoid common pitfalls you may encounter. Our customers typically want to perform such tests on the radios alone before integrating them into an application such as a UAV or a UGV. Measuring the performance without involving your end system (UAV/UGV) is useful as it avoids any problems you might encounter when you integrate the radios into the end-product.
When performing initial field and tests on Mesh Rider radios, customers typically first want to see
- The range that the radios can achieve.
- The throughput that the radios can achieve and at what range.
- The latency of the radios.
Beyond that, customers may also want to see
- The mesh hopping performance of the radios.
- How fast nodes can travel while maintaining a link.
- How many nodes are supported in a single network.
This document will attempt to answer some of these questions, while also providing you with the tools you will need to analyze the radio network. Before going into that, we will discuss the hardware and software you can use for field and bench testing.
Hardware and Software for Field Testing
Hardware
Going through the Mesh Rider radio form factors, the Wearable radios are designed as end products, so they are the easiest radios to test. No additional hardware except your mobile phones are strictly required for testing. The Multiband Wearable User Guide has details about how you can get started.
For the OEM, and mini/nano-OEM form factors, we recommend designing a simple housing for the radios for field and even bench usage. The housing will make it easier to connect your PC or Smart Device, and hook up antennas, without the risk of damaging the radios (e.g. ESD, or mechanical damage). An example of how you could design a simple box is shown in Fig. 1.
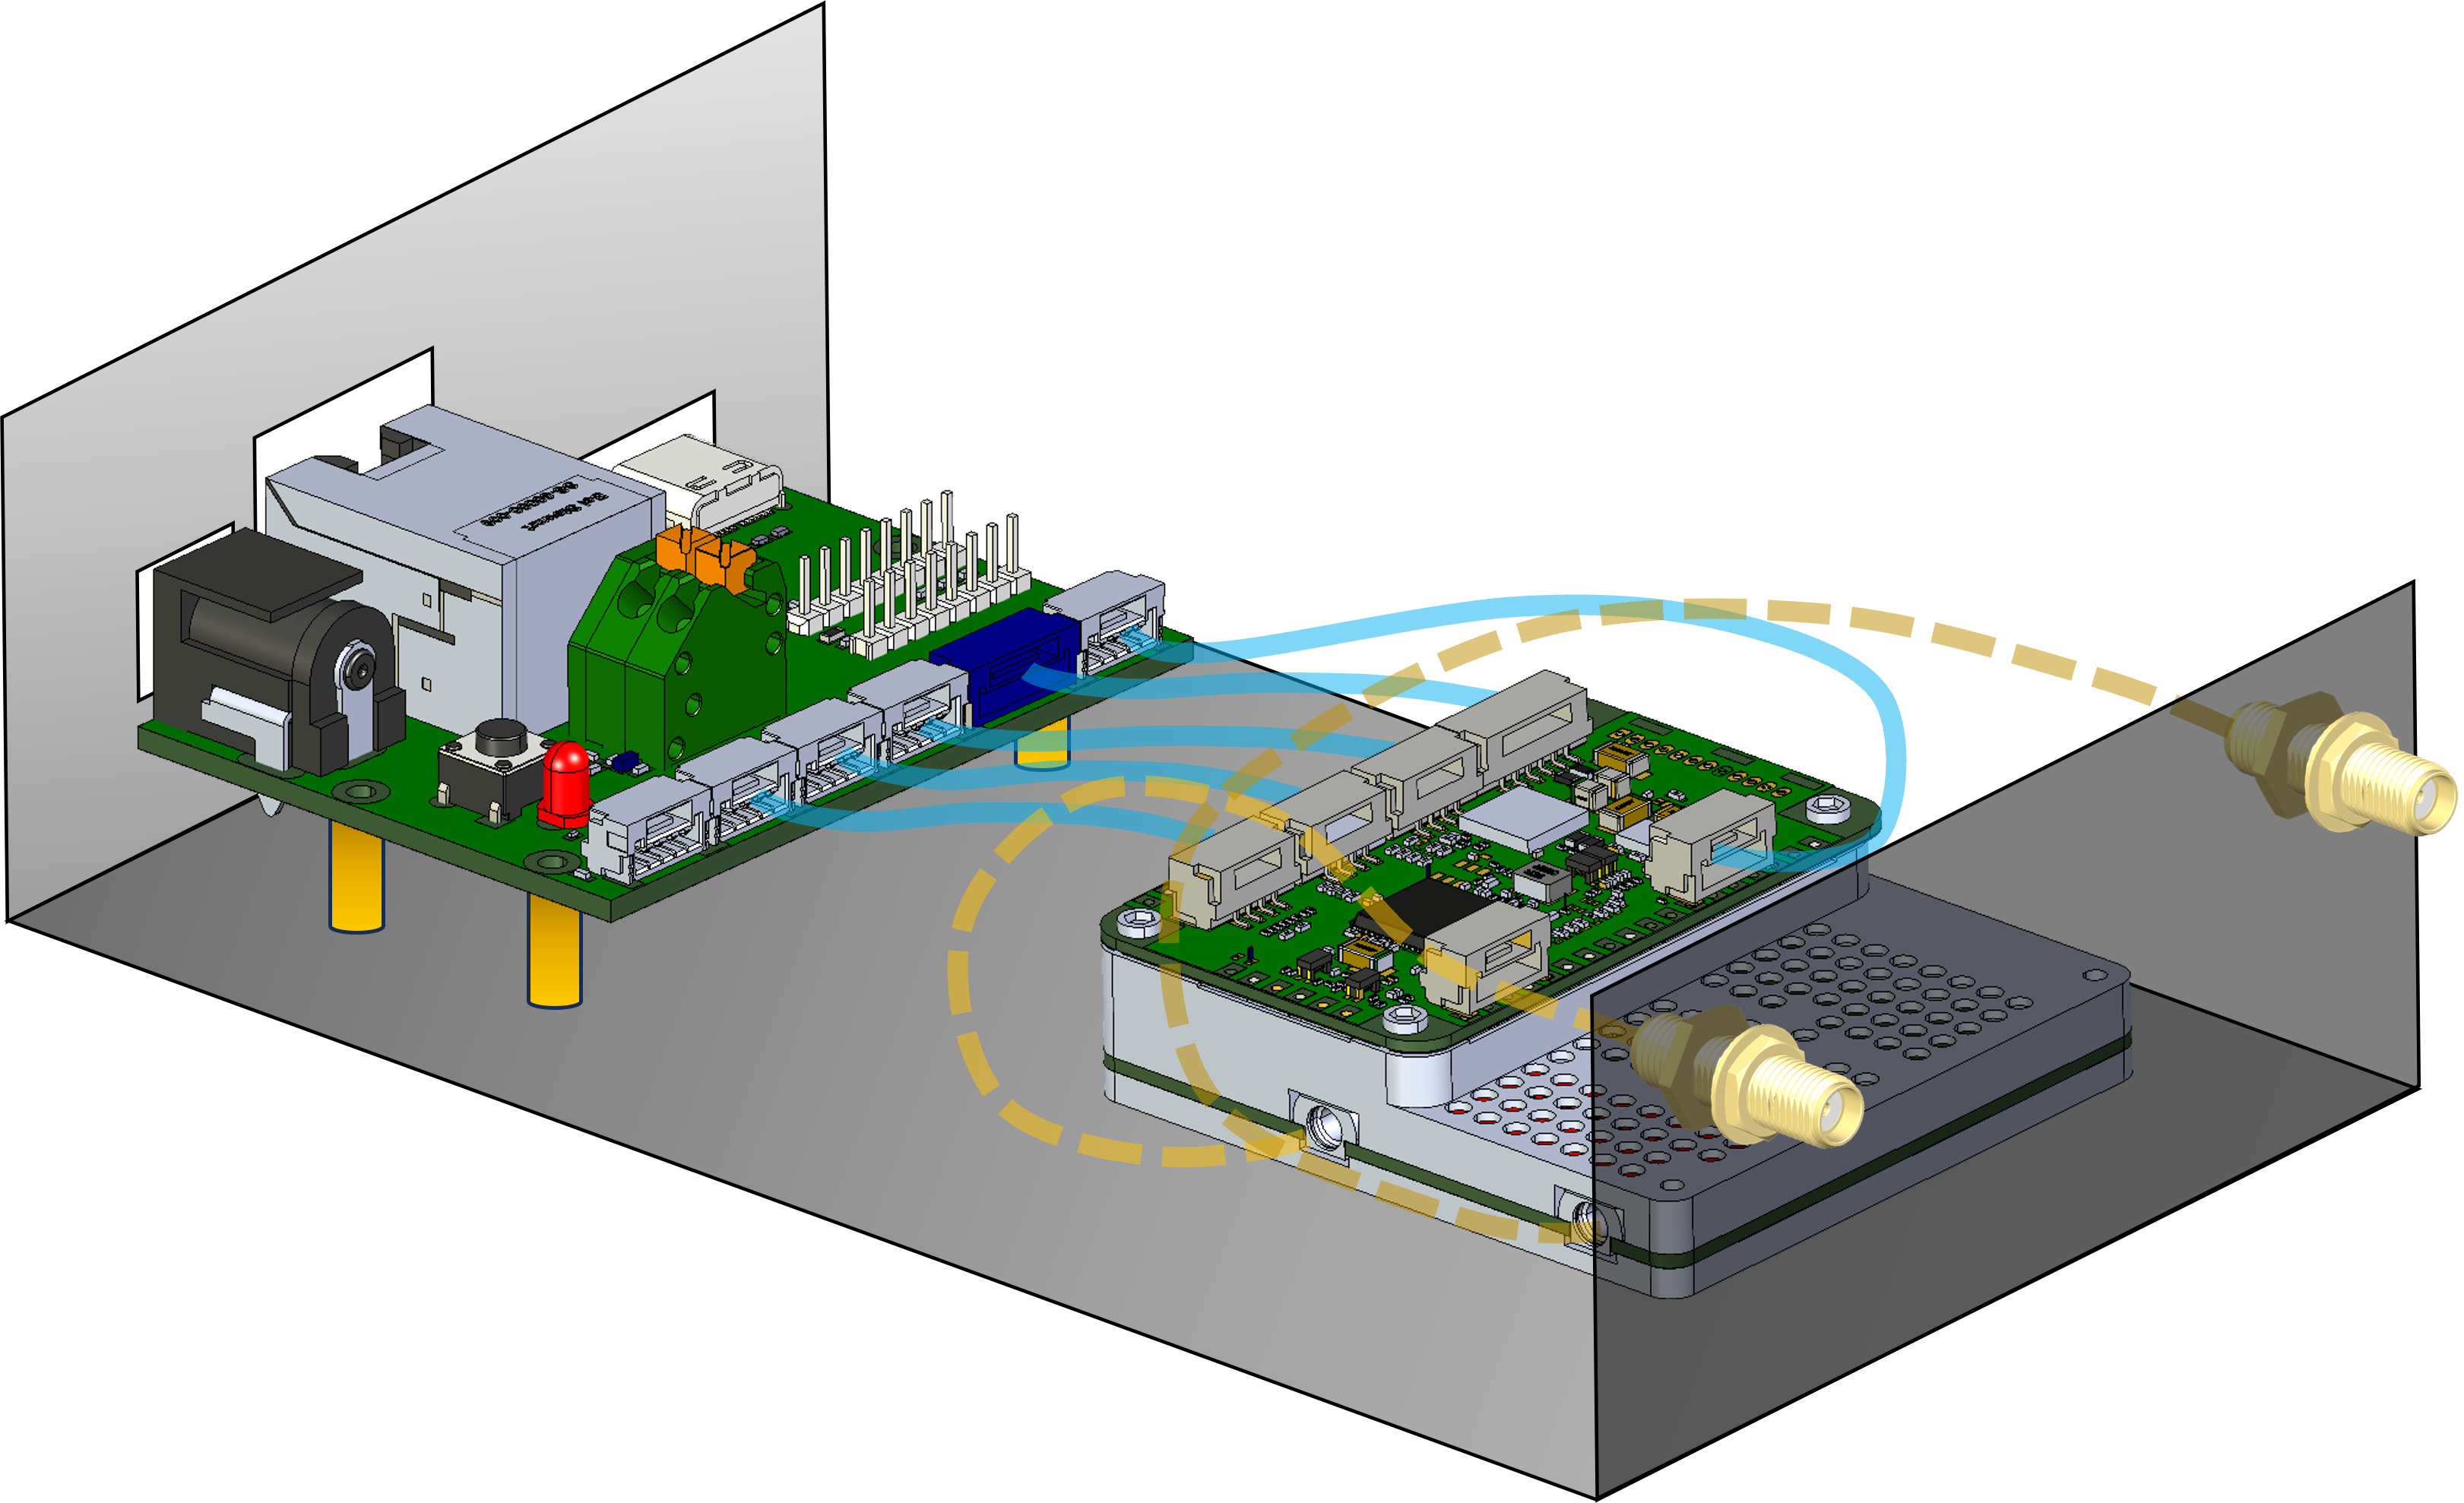
Fig. 1 Field testing box
When designing your box,
- Use a metal box which can act as a heat sink.
- Use a thermally conductive adhesive tape to mount the radio to the box, or use a thermal pad or paste to ensure good thermal contact between the radio and the box.
- Ensure there is sufficient slack on internal cabling, but secure longer cables to the chassis to prevent excessive shaking.
- Ideally, antennas should be separated as much as possible for maximum diversity.
Aside from the radios themselves, you will need a Laptop or a Tablet to run your performance testing software. Laptops running Windows or Linux allow you to better visualize and save the data while also offering better multi-tasking capabilities. For field testing, tablets are easier to carry and typically have a longer lasting battery. A good compromise is a Windows tablet, but bear in mind that they don't have as much battery life as Android tablets.
For RF testing over cable, you will need RF attenuators. Digital step attenuators can make testing easier, but be careful to avoid damaging them. Adding at least 20-dB of attenuation on each port can prevent them from being overloaded.
Test setups
An example of how you could set up your network for field testing is shown in Fig. 2. In this example, we have a Wearable Mesh Rider radio on one end of the link, and a mini-OEM Mesh Rider radio on the other end. Our tablet is connected to the Wearable radio over it's built-in Wi-Fi Access Point. You could also connect to the radio over it's USB-Dev interface. The Laptop can be connected to the mini-OEM radio over it's USB-Dev interface or it's Ethernet interface.
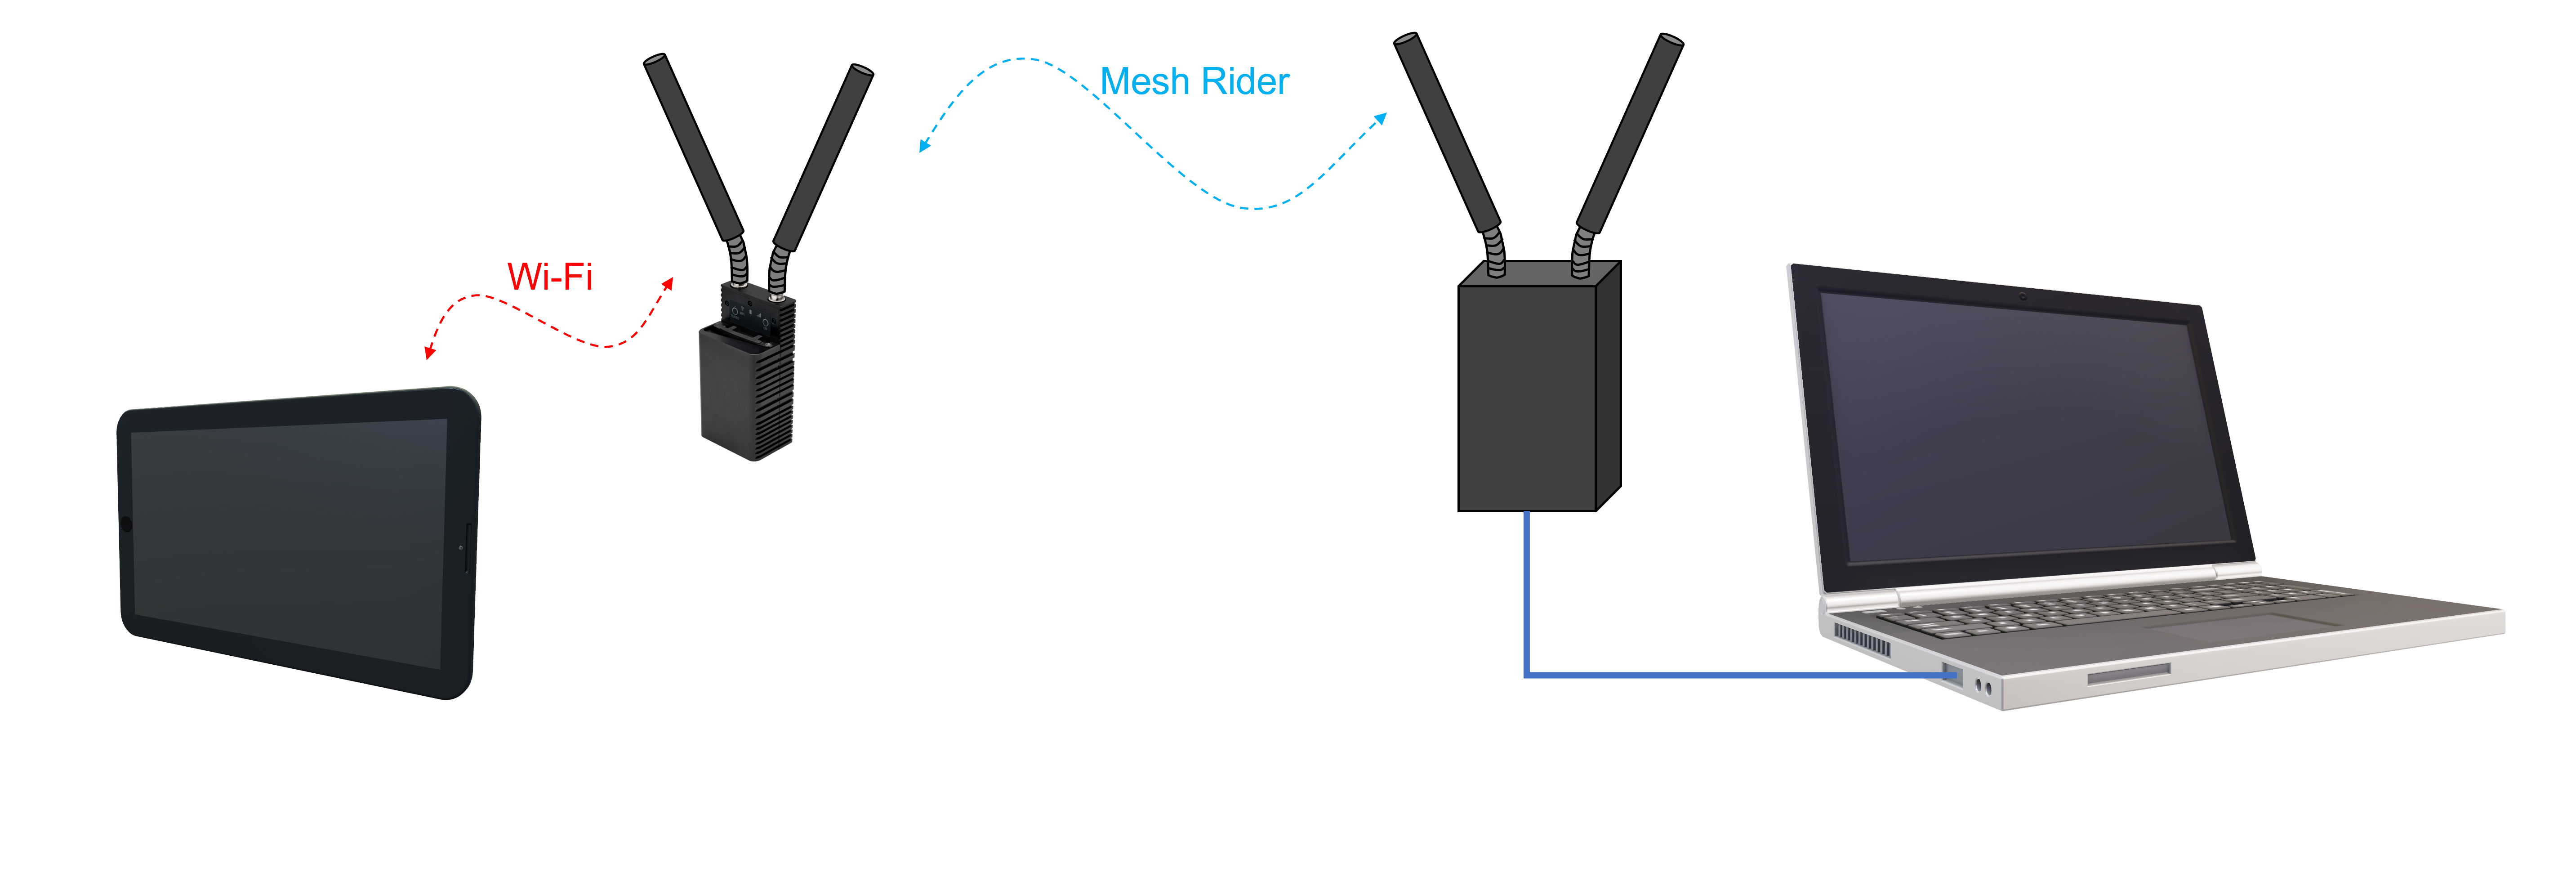
Fig. 2 Example network setup
For bench tests, you can use the example in Fig. 3. Instead of antennas, the radios are connected using RF cables. If you want to test the sensitivity level of the radios, then you may need to either keep them separated by at least a few meters (long cables), or keep them inside RF shield boxes. The radios transmit at high power, and are very sensitive, so within a few meters, they may directly couple to one another making sensitivity measurements meaningless.
In order to prevent the receivers from saturating, the received signal strength should be kept below -30 dBm. Since the typical output power of each radio is around +30 dBm, you will need at least 60-dB of attenuation between the radios. Note that the actual output power and receive sensitivity is model dependent and is listed in the datasheet.
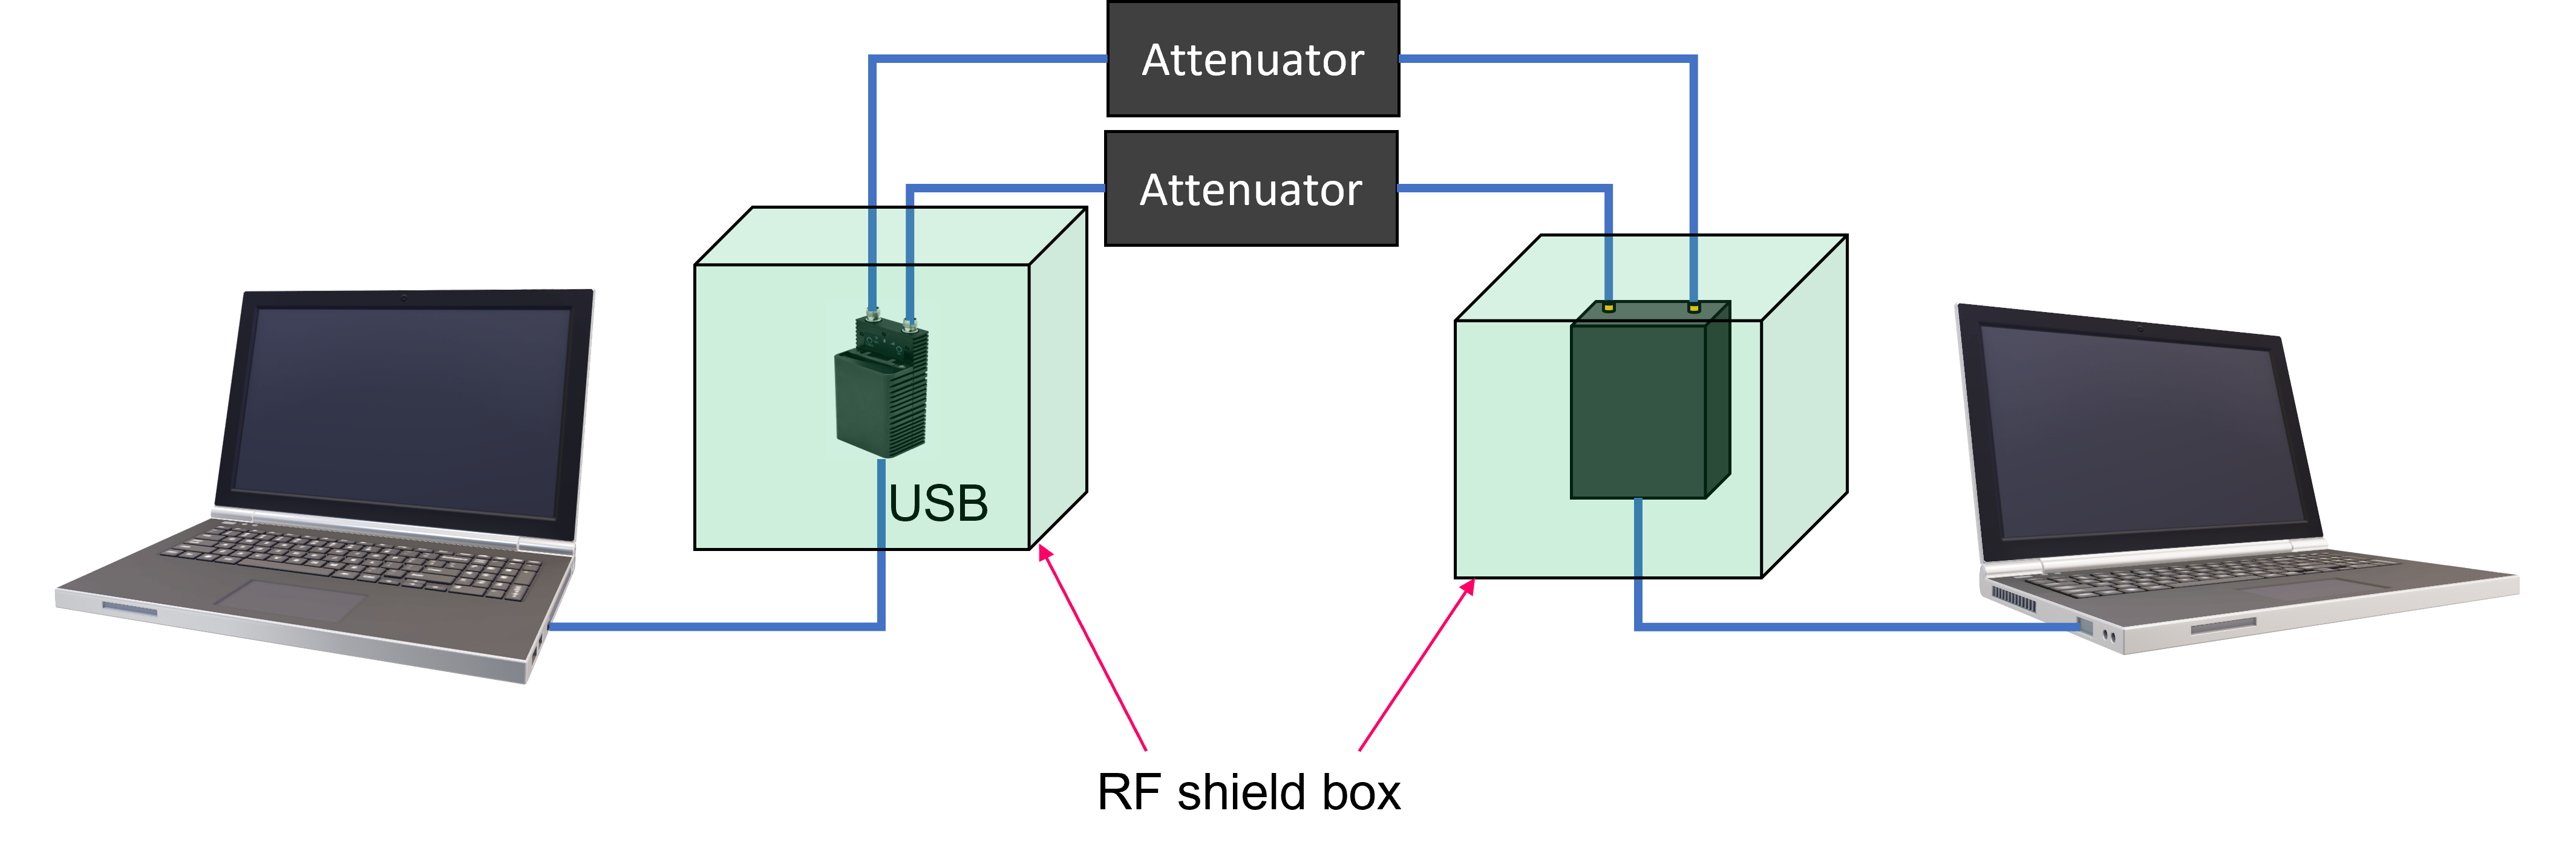
Fig. 3 Bench test setup
Software
In order to be able to get link information from the radio, your best option is using the command-line over an SSH connection. Information on how to SSH into the radio can be found in our Remote Management Guide, and information on our command-line interface can be found in our CLI Guide.
Field Testing Notes
Testing network capacity
A useful application for testing network capacity is iperf3. iperf3 can be used to send data across the network in either UDP or TCP modes. iperf3 is a client/server application. An iperf3 server is first started on one end of the link using the command
iperf3 -s
The client connects to the server using the command
iperf3 -c <IP ADDRESS> <OPTIONS>
<IP ADDRESS> is the IP address of the PC running the iperf3 server. By default, data is sent from the client to the server. For a full list of options, run iperf3 --help. Here we will present some useful examples.
iperf3 -c <IP ADDRESS> -t 10 -i 1
iperf3 runs in TCP mode by default. In the above example, the client sends data as fast as possible using TCP for 10 seconds (-t 10), with a reporting interval (-i 1) of 1 second.
iperf3 -c <IP ADDRESS> -t 60 -i 1 -u -b 5M -R
In this example, iperf3 runs in UDP mode (-u). The duration is 60 seconds (-t 60), the bandwidth is fixed at 5 MBps (-b 5M), and data flows in the reverse direction (-R) from the server to the client. Note that in UDP mode, you must specify the bandwidth in order to get meaningful results. In UDP mode, packet loss is reported.
TCP mode is a good way to see the maximum capacity of the network, while UDP mode is useful for seeing how robust the link is. For example, if a link is intermittently bad, the TCP mode throughput might still be good, but a UDP link will show periodic packet drops.
Testing Latency
The easiest way to check latency is by using the ping utility. The ping utility is built-in to most commonly used operating systems, but the behavior between Windows and Linux is slightly different. We recommend using Linux as it is more versatile. As an example, try running the following ping command in a Linux system
ping <IP ADDRESS> -i 0.2 -s 250 -Q 0xC0
<IP ADDRESS> is the IP address of the host you wish to ping. The ping interval is 0.2 seconds (-i 0.2). The size of the data is 250 bytes (-s 250). The DSCP in the IP header is set to CS6 (-Q 0xC0). The ping utility allows you to set the TOS field in the IP header. TOS to DSCP mappings can be found here. The radio routes CS6 marked packets through the URLLC queue which has high priority but limited bandwidth.
Note that ping returns the round-trip-time, and the latency of a packet in one direction is lower.
Maximum throughput conditions
In order to get the maximum throughput, several conditions must be met. However, note that the maximum throughput depends on the range. See our Throughput Estimation tool for an estimate on the achievable throughput versus range.
- The channel bandwidth of the radio must be set to the maximum (usually 20-MHz).
- The antennas must be mounted orthogonally to one another and be separated outside of each other's near-field distance. See our Antenna Recommendations for UAS and UGVs guide for details.
- There should be no outside interference. The radios can talk in-between intermittent noise sources, and talk over low-level noise sources, but in general, interference will degrade the overall throughput.
- The link should be stable. If the link is not stable, then the radio will automatically reduce it's modulation rate. Some common scenarios where this is important include:
- For a moving vehicle, the link quality can change very rapidly due to the strong multipath environment. This can be true even when there are no apparent obstructions in or near the LOS.
- Over choppy water, the RF link can actually change very rapidly. Salt water acts as a good reflector to EM waves, and the choppy water results in a rapidly varying multipath link.
- When a UAV yaws/pitches/rolls, the alignment of the antennas towards the GCS can change, causing the polarization to mismatch and result in a sudden change in the RSSI. In some cases, the body of the UAV may block an antenna, with the same effect (we recommend mounting your antennas so that this doesn't happen).
- There should be sufficient Fresnel Zone clearance.
Useful Radio Metrics
While conducting your tests, you may want to get information from the radio to understand the throughput performance you are getting. A good way to get a summary of the overall radio performance is by using the Link Status Log.
Below are some useful commands which you can execute in the radio's command prompt.
Peer to peer connectivity
- First get the PHY number of the Mesh Rider radio. In most cases it is
0, but in some multi-radio models, it is1.
PHY=$(/usr/share/simpleconfig/get_fes_phy.sh)
-
Get the connectivity information to all other stations
iw wlan${PHY} station dumpSome of the more important fields in the output include:
inactive time: 20 ms. This tells us that it has been 20 ms since a packet was received from this station. This number is typically in the tens of milliseconds.signal: -52 [-54, -56] dBm. This tells us that the total received signal strength from this station is -52 dBm, antenna 0 is getting -54 dBm, and antenna 1 is getting -56 dBm. Anything stronger than -70 dBm is a good signal, and the sensitivity level is typically around -90 dBm (see the datasheet for details).tx/rx bitrate: 65.0 MBit/s MCS 7. This is the MCS rate transmitted to or received from this station. A high MCS rate indicates a good link quality. Note that the MCS rate is dynamically adjusted, and may appear to jump around a lot.
Mesh routing information
-
Get mesh routing information using the command
batctl oA listing of the output is shown below.
Originator last-seen (#/255) Nexthop [outgoingIF] * 00:30:1a:4e:bb:01 0.060s (251) 00:30:1a:4e:bb:01 [ wlan0] 00:30:1a:4e:bb:01 0.060s (120) 00:30:1a:4e:bb:02 [ wlan0] * 00:30:1a:4e:bb:02 0.070s (239) 00:30:1a:4e:bb:02 [ wlan0] 00:30:1a:4e:bb:02 0.070s (129) 00:30:1a:4e:bb:01 [ wlan0]- Each node in the mesh is an originator. In this example, there are three originators including the node running the command.
- The
Nexthopfield tells us the next station that packet will be transmitted to to get to a particular originator. - The
*next to a line means that this is the best route towards a particular originator. last-seentells us how long it has been since a mesh packet was received from this interface.(#/255)is a figure-of-merit used to judge the quality of a particular route.
Other useful information
- Get the percentage of airtime being used by running
sysutils activity. It runs for 5 seconds. This number shows you how saturated the wireless network is. It also shows you the amount of data in the air. - Get the CPU load using
cat /proc/loadavg. This tells you how loaded the CPU is. - Get memory usage information using the
freecommand. This is only important if you are running your own application inside the radio.