The Command-Line Interface
Introduction
If you login to the Mesh Rider Radio's Linux Ash shell (similar to Bash) using SSH, you can run Linux commands. This guide discusses the following types of CLI commands
- Common CLI Commands
- UCI
- UBUS
- Central Configuration
- The Link Status Log
Ultimately, you may want to run some of these commands remotely over the API. This is discussed in our Remote Management Guide.
Common CLI Commands
The Mesh Rider Radio uses the Almquist shell (Ash) (https://en.wikipedia.org/wiki/Almquist_shell), which is similar to Bash. If you know Bash, you will find the Mesh Rider Radio CLI very familiar. If not, we recommend going through one of the many online tutorials on Bash. The tables below summarize commands you are likely to use in the course of your Mesh Rider Radio testing.
Real-Time Configuration
The commands below work on-the-fly, but do not survive a network restart or reboot.
| Command | Purpose |
|---|---|
iw wlan0 set txpower fixed 2000 |
Sets the TX power to 20 dBm. Note that the power is measured in millibels, so divide by 100 to get decibels. |
iw wlan0 set txpower auto |
Sets the TX power to auto (highest power) |
iw wlan0 set bitrates ht-mcs-2.4 <RATE> |
Fixes the bitrate. |
iw wlan0 set bitrates |
Sets the MCS rate to auto |
iw dev wlan0 mesh chswitch <CHANNEL> <# BEACONS> |
Sends a channel switch announcement to all MESH nodes to switch to |
hostapd_cli chan_switch <# BEACONS> <FREQ> ht |
Sends a channel switch announcement to all WDS Client nodes to switch to |
Getting Connection Information
| Command | Purpose |
|---|---|
iw wlan0 station dumpOR iw wlan0 station get <MAC> |
Gets information about all connected stations or an individual station. |
iwinfo wlan0 assoclist |
Information on all associated stations |
iw wlan0 info |
Get information about the current wireless settings |
iw wlan0 survey dump |
Get channel usage statistics |
batctl |
See a list of commands for mesh interface information and configuration |
batctl o |
See information about connected mesh nodes including preferred hop (*), last-seen time, transmit quality (#/255)… |
Networking Information
| Command | Purpose |
|---|---|
ifconfig br-wan |
Show information about the WAN bridge |
ip a show br-wan |
Show information about the WAN bridge |
route -n |
Show the routing table |
netstat -tuapn |
Show socket connection information |
arp |
Show the address resolution protocol table. |
ip a |
Show information about IP addresses |
fw3 print |
fw3 is a front end to iptables and can be used to configure the firewall. |
cat /proc/net/nf_conntrack |
See exiting network connections |
bmon -bOR bmon -b -p wlan0 |
Network usage information |
System Information
| Command | Purpose |
|---|---|
dmesg |
See kernel messages |
cat /var/log/messagesOR logread |
See system log messages |
top |
Check processor load |
free |
Check memory usage |
UCI
The UCI system is used for persistent configuration. Most UCI files are found at /etc/config/. This is a slow method of configuration, but changes are saved over a reboot. The general procedure for making a UCI configuration change is
-
To show the existing configuration, run
uci showto show the full UCI configuration or
uci show wirelessto shows the wireless configuration (for example).
-
Modify a configuration and commit the change (this saves the change)
uci set wireless.radio.chanbw=5
uci set wireless.radio0.txantenna='1'
uci commit
This sets the channel bandwidth to 5 MHz. You can save individual sections too. For example
uci commit wireless. After committing changes, you need to restart the service. -
After making configuration changes, restart the relevant service. You can see a list of services by running
ls /etc/init.dAfter that, restart the service. For example,
/etc/init.d/socat restartwill restart the socat service (serial interface). Note that
/etc/init.d/network restartwill restart all networking related services including the wireless. If you have only made changes to thewirelessconfiguration, you can just runwifi(this is an exception as the wireless config file doesn't have a corresponding init script).
UBUS
Making calls using UBUS
Calls to the JSON-RPC API go through the Openwrt ubus system (https://openwrt.org/docs/techref/ubus). Before going into the JSON-RPC API, you should become familiar with ubus. In order to run ubus directly, first SSH into the radio. You can view a list of available ubus commands using (result abridged)
root@smartradio:~# ubus list
central-config
dhcp
dnsmasq
file
iwinfo
…
Note that the central-config call is only available after enabling the Central Configuration utility. You can get information about how to use specific ubus calls by running
root@smartradio:~# ubus -v list <CALL>
For example,
root@smartradio:~# ubus -v list iwinfo
'iwinfo' @68374f72
        "devices":{}
        "info":{"device":"String"}
        "scan":{"device":"String"}
        "assoclist":{"device":"String","mac":"String"}
        "freqlist":{"device":"String"}
        "txpowerlist":{"device":"String"}
        "countrylist":{"device":"String"}
        "survey":{"device":"String"}
        "phyname":{"section":"String"}
An example of how to use the iwinfo call is shown below. We replaced "String" with "wlan0" (result abridged).
root@smartradio~# ubus call iwinfo assoclist '{"device":"wlan0"}'
{
        "results": [
                {
                        "mac": "00:30:1A:4E:BB:09",
                        "signal": -47,
…
Parsing the json output
We can filter these results using the jsonfilter utility. Note in the JSON file above that the results property is an array of values, one for each connected station.
root@smartradio:~# ubus call iwinfo assoclist '{"device":"wlan0"}' | jsonfilter -e '@.results[1].mac' -e '@.results[1].signal'
00:30:1A:4E:BB:01
-62
Or if you know the MAC address of the device you want to filter, you can use
root@smartradio:~# ubus call iwinfo assoclist '{"device":"wlan0"}' | jsonfilter -e '@.results[@.mac="00:30:1A:4E:BB:01"].signal'
-62
In general, however, we recommend parsing data on your local machine where it should be easier.
Sense
Sense is the name of our upgraded Central Configuration, Automatic Band/Channel/Bandwidth selection, and Link Recovery utility. Sense was introduced in the July 2023 Beta Resilience Release and heavily updated in the Sept 2023 Sense release. Sense is discussed in more detail here.
Noise scanning over the CLI
The firmware integrates a manual band scanning utility which allows the user to scan specific band/channel/bandwidths for noise. You can modify the list of scanned frequencies by editing the file /etc/scanlist.json. The default is shown below. A limitation of this utility is that the second frequency to be scanned in each submodel must be more than 5-MHz higher than the first (they also must be valid channels). Therefore, you will not be able to scan frequencies 2412 MHz and 2417 MHz in the RM-2450-2L-X submodel. In general, you should scan non-overlapping channels with a wide bandwidth, but scanning the 2.4-GHz band with a 20-MHz bandwidth could lead to incorrect results due to the presence of third-party Wi-Fi devices.
$ cat /etc/scanlist.json
{"scanlist":[
        {"model":"RM-1675-2L-X","bandwidth":"10000","freq":["1650","1670","1690"]},
        {"model":"RM-2245-2L-X","bandwidth":"10000","freq":["2220","2250","2280"]},
        {"model":"RM-2450-2L-X","bandwidth":"10000","freq":["2412","2432","2452"]}
]}
To run a scan, execute the command switch-scan-new.sh. The results will be in a table format at /tmp/scan_results
$ cat /tmp/scan_results
FREQ noise-AVG noise-75% noise-90% noise-MAX num-scans
1650 -102.923950 -97.472015 -94.953606 -83.101387 24
1670 -96.610970 -91.465370 -86.563614 -84.484718 29
1690 -95.679008 -89.701218 -86.749275 -79.336105 24
2220 -103.718758 -97.790871 -93.297089 -88.014229 26
2250 -108.324417 -102.998260 -100.864838 -97.243042 25
2280 -104.529037 -98.920143 -94.081635 -91.797234 27
2412 -97.080002 -89.835823 -83.133896 -71.869949 25
2432 -91.229301 -79.683624 -68.121605 -62.148979 17
2452 -99.396301 -96.636200 -86.066101 -71.173927 27
- FREQ : The frequency being scanned
- noise-AVG : The average noise level over all OFDM sub-carriers
- noise-75% : The noise level which 75% of the OFDM sub-carriers is below
- noise-90% : The noise level which 75% of the OFDM sub-carriers is below
- noise-MAX : The maximum noise level of any sub-carrier
- num-scans : The number of scans performed at this frequency
Typically, the noise-75% column is a good reference as the radio uses forward-error correction (FEC) to correct for some percentage of the bit errors. You can sort the table using awk. For example, to sort the table by the noise-75% level, run
$ cat /tmp/scan_results | awk '{print $3" "$1}' | sort -n -r | awk '{print $2" "$1}'
FREQ noise-75%
2432 -79.683624
2412 -89.835823
1690 -89.701218
1670 -91.465370
2452 -96.636200
2220 -97.790871
1650 -97.472015
2280 -98.920143
2250 -102.998260
As a scan at a single frequency is very brief, it will not capture intermittent sources of noise that are not present at the time of the scan. You can see how the noise in a particular channel is changing over time by simply repeating it in the scan list. For example,
$ cat /etc/scanlist.json
{"scanlist":[
        {"model":"RM-1675-2L-X","bandwidth":"10000","freq":["1650","1650","1650","1650","1650","1650","1650","1650","1650","1650","1650","1650"]}
]}
Link Status Log Utility
The Link Status Log utility is designed to log the radio's link status over time. It keeps much more detailed information that the Central Configuration utility, but each node operates separately and does not share information with other nodes. Aside from downloading the logs, you can also get the latest status from any particular node.
Enabling the Link Status Log in the GUI
The Link Log utility was introduced in the October 2022 firmware release. Each device independently maintains a log of the link status information. The Link Log utility can be configured at Services -> Link Status Log. Fig. 2 shows the configuration page.
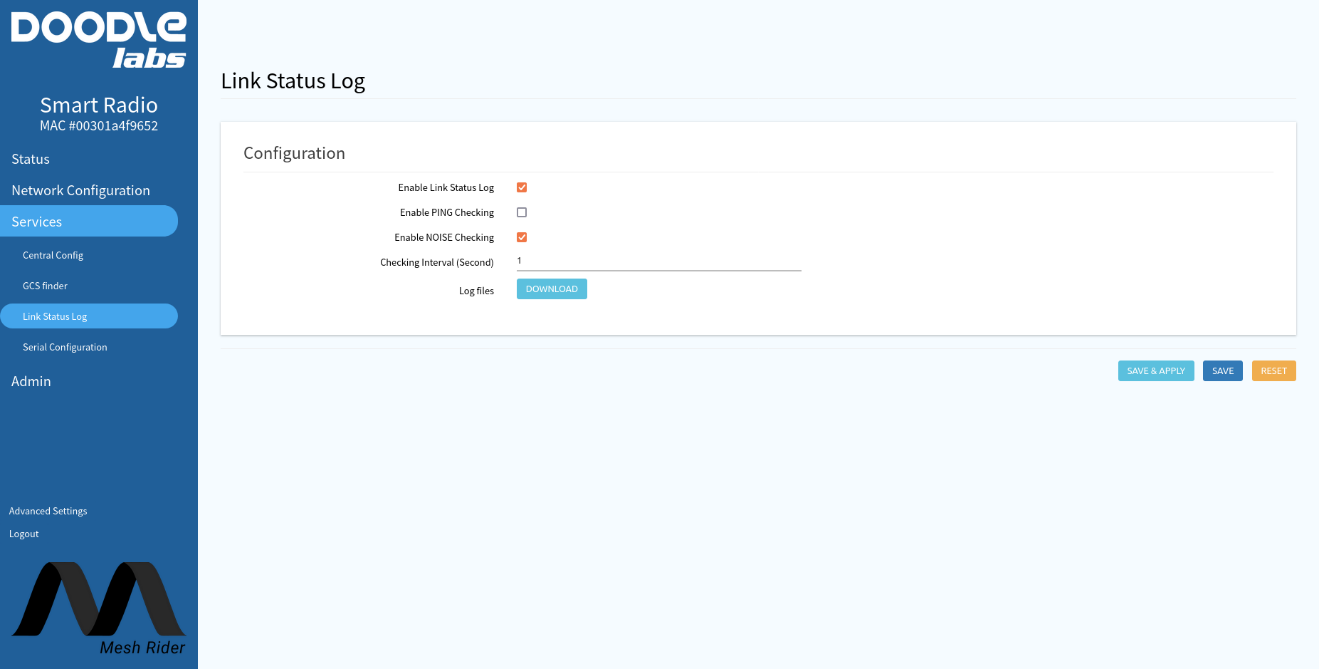
Fig. 2 Link Status Log
The logs can be downloaded directly from the GUI. Alternatively, the logs are accessible in the shell in the folder /tmp/longtermlog.
Viewing the logs
The contents of the Link Log utility are shown here,
root@smartradio:/tmp/longtermlog# ls
22-05-05_13-26-21.log  22-05-05_13-51-09.log  22-05-05_14-14-34.log  ipv6list status.json
The log files are limited to 500 lines, and the file name is the date when the log started. Aside from long term logs, the Link Log utility keeps the latest status line in the file /tmp/longtermlog/status.json. The output of each line is,
{
  "date": "22-05-05_13:44:05",
  "ipv6list": [
    {
      "ip6address": "fe80::78c6:240f:42e6:7787",
      "rtt": "1.757"
    }
  ],
  "stations": [
    {
      "mac": "00:30:1A:50:3B:A0",
      "signal": -54,
      "signal_ant": [
        -59,
        -56
      ],
      "signal_avg": -54,
      "noise": -95,
      "inactive": 20,
      "connected_time": 1043,
      "thr": 29718,
      "authorized": true,
      "authenticated": true,
      "preamble": "long",
      "wme": true,
      "mfp": true,
      "tdls": false,
      "mesh llid": 0,
      "mesh plid": 0,
      "mesh plink": "ESTAB",
      "mesh local PS": "ACTIVE",
      "mesh peer PS": "ACTIVE",
      "mesh non-peer PS": "ACTIVE",
      "rx": {
        "drop_misc": 55,
        "packets": 69813,
        "bytes": 7679137,
        "ht": true,
        "vht": false,
        "mhz": 10,
        "rate": 19500,
        "mcs": 4,
        "40mhz": false,
        "short_gi": false
      },
      "tx": {
        "failed": 4,
        "retries": 199,
        "packets": 18283,
        "bytes": 3007957,
        "ht": true,
        "vht": false,
        "mhz": 10,
        "rate": 29250,
        "mcs": 6,
        "40mhz": false,
        "short_gi": false
      }
    }
  ],
  "wirelessStats": {
    "noise": "-93.081978",
    "act_s": 3.02,
    "bus_s": 0.06,
    "RX_kb": 200,
    "TX_kb": 142,
    "usrrst": 25,
    "Fatal": 0,
    "TXPath": 0,
    "bbhang": 0,
    "deafhang": 0,
    "backlog": 0,
    "channel": 12,
    "frequency": 915,
    "bandwidth": 10
  },
  "Batman_info": [
    {
      "hard_ifindex": 10,
      "orig_address": "00:30:1a:50:3b:a0",
      "best": true,
      "last_seen_msecs": 60,
      "neigh_address": "00:30:1a:50:3b:a0",
      "tq": 248
    }
  ],
  "CPU_info": "2.18 1.74 1.14 4/64 9150",
  "Mem_info": "58748K total, 14464K free, 5240K buff, 12080K cached"
}
The output is in JSON format with the following sections. Some options may not be enabled by default in the GUI.
- Time stamp. This is the time stamp for the information set.
- Ipv6 station list. This section shows the Ipv6 address of each connected station, and the round-trip time to that station.
- Stations. This section shows layer 2 connectivity information to all nodes in the network. It shows the output of the command
ubus call iwinfo assoclist '{"device":"wlan0"}'. Some important fields include- inactive: time in milliseconds since a packet was received by the wireless interface.
- signal: total RSSI of the packets received from that station
- signal_ant: RSSI of the packets received from that station in the format "antenna0, antenna1".
- tx.mcs: latest MCS rate for packets sent to that station.
- rx.mcs: latest MCS rate for packets received from that station.
- Wireless Statistics
- noise: level of the background noise in dBm
- act_s: active time in seconds since the last time-stamp
- bus_s: the amount of time the wireless medium was in use by any station in seconds. The medium usage duty cycle is bus_s/act_s.
- RX_kb: amount of data received in kilobits since the last time-stamp.
- TX_kb: amount of data transmitted by this node in kilbits since the last time-stamp.
- The remaining fields are driver related and should be diagnosed by Doodle Labs technicians if required.
- Batman Info. This section details the mesh routing statistics
- hard_ifindex: ignore this
- orig_address: The station that this set of statistics covers. Each station in the mesh is called an originator.
- best: Is this section the next best hop?
- last_seen_msecs: Time since the mesh routing layer has seen a packet from this originator.
- neigh_address: The next hop towards this originator.
- tq: The Transmit Quality figure of merit out of 255 which is used to calculate the next best hop.
- CPU_info. CPU load information
- Mem_info. Memory usage information.
Creating a Bootup Script
The Mesh Rider Radio uses Openwrt's procd system for init scripts (https://openwrt.org/docs/guide-developer/procd-init-script-example).
Example
We will create a simple script to echo a message to the system logs every 5 seconds. Save the following listing as /usr/bin/my_startup_script.sh
#!/bin/sh

while (sleep 5) do
        logger -t "My Message" "Hello"
done
You now have to make the script executable. Run
chmod +x /usr/bin/my_startup_script.sh
You can use the following basic listing for a startup script. Save the file in your Mesh Rider Radio as /etc/init.d/my_init_script.
#!/bin/sh /etc/rc.common

USE_PROCD=1
START=99
PROG="/usr/bin/my_startup_script.sh"

start_service() {
        procd_open_instance
        procd_set_param command $PROG -p $PORT
        procd_set_param respawn 0 5 0
        procd_close_instance
}
After creating the file, make it executable, and then enable and start the init script.
chmod +x /etc/init.d/my_init_script
/etc/init.d/my_init_script enable
/etc/init.d/my_init_script start
You can also follow the system log messages from my_startup_script.sh by running
logread -f "My Message"
Appendix A: Central Config (Legacy)
The Central Configuration utility is designed to quickly modify the operating channel, TX power, and distance setting, and to poll status information from the entire network of radios. After enabling Central Config in the GUI, it is possible to perform Central Config tasks over the SSH and JSON-RPC APIs. See the Remote Management Guide for details. As each radio uses the Central Config utility to send its own link information to the primary node, the central configuration utility is a good way to get limited network-wide status information.
Enabling Central Config in the GUI
If you have gained some familiarity with ubus, you can run Central Config commands over ubus. You can use Central Config to either send configuration changes to the entire network or get status information from each node in the network. You will need to enable Central Config in the GUI first. Navigate to Services -> Central Config in the GUI to enable the service. Fig. 1 shows the Central Config configuration page. Note that one node should be elected as the primary node, and all other nodes need to put the primary node's IP address in the Address bar. The Central Config utility uses TLS PSK for security, and it can be configured in the second tab.
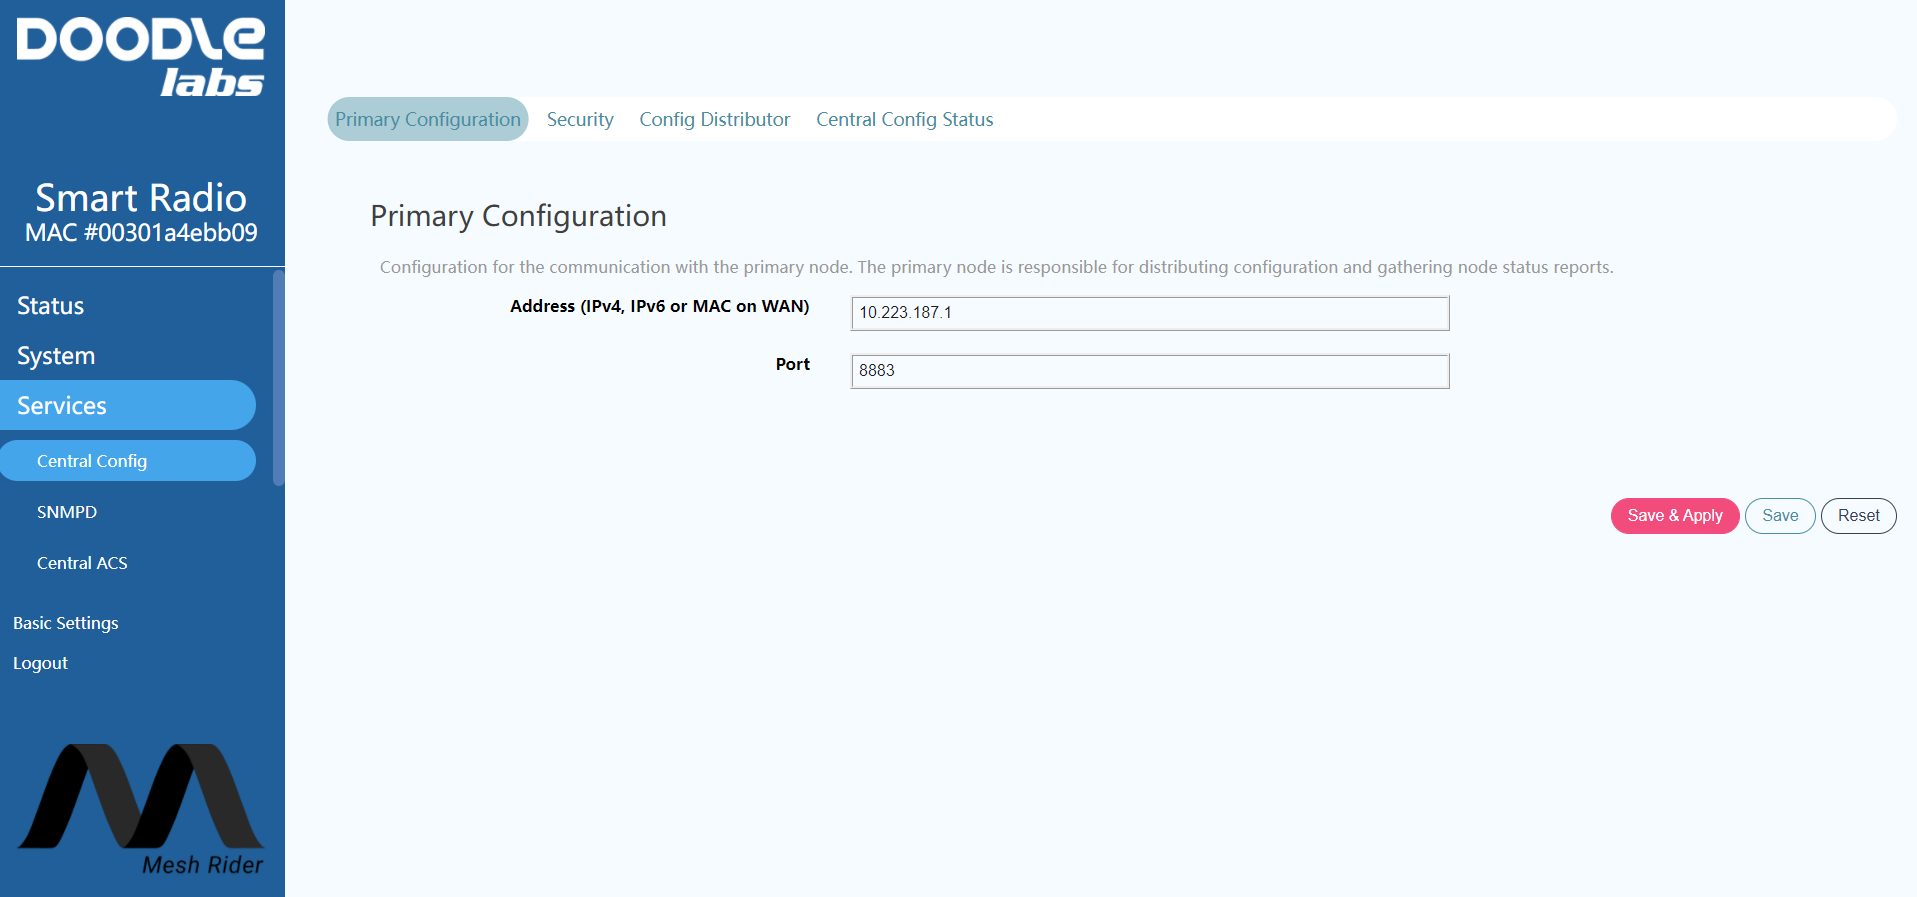
Fig. 1 Central Config configuration page
Sending a configuration change request
Currently only three parameters are implemented over Central Config: the operating channel, the distance setting (in meters), and the TX power level (in dBm). Additional options may be added in future. These settings are controlled by the ubus Central Config properties "channel", "distance", and "txpower". For example, to change the operating channel, run
root@smartradio:~ # ubus call central-config config '{"dest":"all","delay":0,"config":{"channel":"51"}}'
This tells all devices in the network to switch to channel 51. If you run "iw wlan0 info" after running the above command, you should see that the radios have moved to the new channel (make sure it is a valid channel first).
- The
"delay"property can be used to delay the execution of the call (in seconds). - The property
"dest"can be either"all","primary", or a specific MAC address. - The property
"config"is actually a generic property in JSON format. When a node receives a new message, it executes all scripts in the folder/usr/lib/doodlelabs/central-config. It is up to those scripts to parse the json data and perform actions based on the received data.
Getting a status update
To get a status update over Central Config, run the command
root@smartradio:~ # ubus call central-config config '{"dest":"all","delay":0,"apply":"true","config":{"request_status":"1"}}'
You will not see an output, but each radio defined by "dest" will send a status update which will be appended to /tmp/status.json. This file grows each time a new status update is received. We can once again use the jsonfilter utility to parse the /tmp/status.json file. For example, to get a list of MAC addresses, run
root@smartradio:~# jsonfilter -i /tmp/status.json -a -e '@[*].mac' | sort -u
00:30:1A:4E:AA:01
00:30:1A:4E:AA:02
00:30:1A:4E:AA:09
-i: file input-a: because the file is a stack of several JSON strings, this switch treats the file as an array-e: filter patternsort -u: remove duplicates
To get the latest status update from a particular MAC address, run
root@smartradio:~# jsonfilter -i /tmp/status.json -a -e '@[@.mac="00:30:1A:4E:AA:01"]' | tail -n1
{
  "mac": "00:30:1A:4E:AA:01",
  "hostname": "smartradio-301a4ebb01",
  "model": "RM-2250-2J-X",
  "Interfaces": [
    {
      "wlan0": {
        "mac": "00:30:1A:4E:BB:01",
        "associations": [
          {
            "mac": "00:30:1A:4E:BB:09",
            "signal": -52,
            "inactive": 0,
            "tx_mcs": 65000,
            "rx_mcs": 58500,
            "tx_packets": 368820,
            "rx_packets": 1069144
          },
          {
            "mac": "00:30:1A:4E:BB:02",
            "signal": -59,
            "inactive": 0,
            "tx_mcs": 65000,
            "rx_mcs": 58500,
            "tx_packets": 368938,
            "rx_packets": 1063279
          }
        ],
        "Batman_originator": [
          {
            "best": "true",
            "orig_address": "00:30:1a:4e:bb:02",
            "last_seen_msecs": 90,
            "tq": 239
          },
          {
            "best": "true",
            "orig_address": "00:30:1a:4e:bb:09",
            "last_seen_msecs": 60,
            "tq": 246
          }
        ]
      }
    }
  ],
  "phy0": {
    "aqm_backlog": 0
  }
}
@[]: print only the array element defined in the square braces@.mac="00:30:1A:4E:AA:01": filter the array element with this matching MAC address
When first using this API, we recommend copying the file to your local machine, and parsing the data using jq (https://stedolan.github.io/jq/), which will make the output human readable. If we want to get an array of MAC addresses, and corresponding RSSI, we need to run the command
root@smartradio:~# jsonfilter -i /tmp/status.json -a -e '@[@.mac="00:30:1A:4E:AA:01"]' | tail -n1 | jsonfilter -e '@.Interfaces[0].wlan0.associations.results[*].signal' -e '@.Interfaces[0].wlan0.associations.results[*].mac'
-63
-54
00:30:1A:4E:BB:02
00:30:1A:4E:BB:09
We could also run this command twice, once to get the MAC addresses, and the second time to get the RSSI. However, in most cases, it makes more sense to parse the json file on your local machine rather than in the Mesh Rider Radio.